Week 16
Sociology 106: Quantitative Sociological Methods
May 5, 2026
Housekeeping
Weekly Assignment #11
- HW 11 was canceled - wanted to make sure you had time to work on final paper/exam
- Will still be able to drop lowest of 10 assignments.
In-class presentations
- Tuesday, April 28/Tuesday May, 5 — 7–10 minutes per student
- See In-Class Presentation page for presentation assignments
- Use slide template on the course site; structure: question → data → results → so what
- Practice out loud at least once before class
Final paper
- Due Thursday, May 7
- Should include a regression model that answers your research question
- Should follow the formatting described in the final paper outline
Final Presentations
Here is the schedule for final presentations. You’ll need to send me your presentation 2 hours before class so I can load them on my laptop.
| Order | Tuesday, April 28 | Tuesday, May 5 |
|---|---|---|
| 1 | Zhexin Chen | Lawrence So |
| 2 | Mengxuan Wu | Doyoung Kwak |
| 3 | Arohi Behara | Azariah Smith |
| 4 | Megan Farrenkopf | Macheng Xiang |
| 5 | Jenny Liu | Violetta Wang |
| 6 | Bianca Chiu | Yihan Zhang |
| 7 | Srisha Raj | Rose Kong |
| 8 | Keyla Barcenas | Anthony Maldonado |
| 9 | Mahak Rathi | Claudia Gomez Bernal |
Course Evaluations
I’ll give you about 10-15 mins at the end of class for Course Evaluations
Agenda
- Final exam format and logistics
- The major concept areas you should be ready for
- How to study efficiently during the final week without trying to memorize everything
Big picture
This review is intentionally high-level. The goal is to help you organize your studying and recognize the kinds of reasoning the exam will ask for, not to preview exact questions.
Final Exam Format
- Date: Monday, May 11, 2026
- Time: 11:30 AM to 2:30 PM
- Place: Dwinelle 246 (Here)
- Format: closed-book, closed-computer
- Structure: 10 multiple-choice questions and 10 short-answer questions
- Points: 20 points total
- What you’ll get: all output you need is provided for you
What this means for studying
Focus on concepts, interpretation, and choosing the right tool for the job. You do not need to memorize long stretches of code.
What You Should Be Ready To Do
Multiple choice
Choosing the right answer from 4 options.
- Identify variable types
- Choose an appropriate probability distribution
- Recognize skew and the normal-curve rules
- Pick the right figure or test
- Distinguish population from sample
- Interpret a p-value or
R^2
Short answer
Give you output or a scenario and ask you to intepret. No by-hand calculations. Hand-write interpretations.
- Read a t-test/chi-square test
- Interpret regression output
- Read and interpret interaction terms and margins plots
- Explain what moderation means and interpret an interaction coefficient
- Evaluate sampling designs and representativeness
- Critique a misleading figure
- Interpret a confidence interval
Examples of Choosing the Right Tool
| Goal | What the variables look like | Good choice |
|---|---|---|
| Show the distribution of one categorical variable | One categorical variable | Bar chart |
| Show the distribution of one continuous variable | One continuous variable | Histogram |
| Compare the mean of a continuous outcome across two groups | Continuous Y + binary group |
Two-sample t-test |
| Study the relationship between two categorical variables | Categorical X + categorical Y |
Chi-square test |
| Model a continuous outcome | Continuous Y |
OLS regression |
| Model a binary outcome | Y = 0/1 |
Logistic regression |
On the exam
Many mistakes come from choosing the wrong tool because the student did not first identify the outcome type.
Inference Refresher
- The 68-95-99.7 rule only applies to an approximately normal distribution
- The Central Limit Theorem is about the sampling distribution of sample means, not about every raw sample looking normal
- A margin of error is the single number (+/-) that measures error around an estimate
- A confidence interval is the full range: estimate plus or minus the margin of error
- Holding everything else constant, a larger sample size usually makes a confidence interval narrower
- A higher confidence level usually makes a confidence interval wider
P-value wording to know well
A p-value is the probability of getting results this extreme, or more extreme, if the null hypothesis were true.
For any output you read on the exam: identify the direction, comment on statistical significance, then interpret substantively in plain language.
Reading OLS Output
| Term | Estimate |
|---|---|
| Intercept | 5.8*** |
| Divorced | -0.9** |
| Widowed | -0.6 |
| Never married | -1.2*** |
| Age | 0.02* |
R^2 |
0.16 |
Outcome: life satisfaction (1–7 scale). Married is the omitted baseline.
- For OLS, the outcome is continuous.
- If one category is missing from the table, that missing category is the baseline/reference group
- A coefficient tells you the expected difference in the outcome, for every 1-unit increase in in variable, holding the other variables constant
R^2tells you how much of the variation in the outcome is explained by the model. In this case, 16%.
Sample interpretation — Never married
Respondents who have never been married are predicted to score 1.2 points lower on life satisfaction than married respondents (the reference group), holding age constant.
Reading Logistic Regression Output
| Term | Odds ratio |
|---|---|
| Income (thousands) | 1.02** |
| Age | 1.03*** |
| Married (1 = yes) | 1.38* |
Outcome: whether the respondent participates in a community organization (1 = yes).
- In logistic regression, the outcome is binary
- Coefficients are interpreted as odds ratios:
- Odds ratio greater than 1 -> higher odds
- Odds ratio less than 1 -> lower odds
- Odds ratio equal to 1 -> no association
- A quick interpretation shortcut is
(OR - 1) x 1001.38->1.38-1~ 38% higher odds0.76->1-0.76~ -24% lower odds
Sample interpretation — Age
Each additional year of age is associated with odds of participating in a community organization that are about 3% higher, holding income and marital status constant.
Interactions and Margins Plots
An interaction asks whether the relationship between X and Y depends on a third variable.
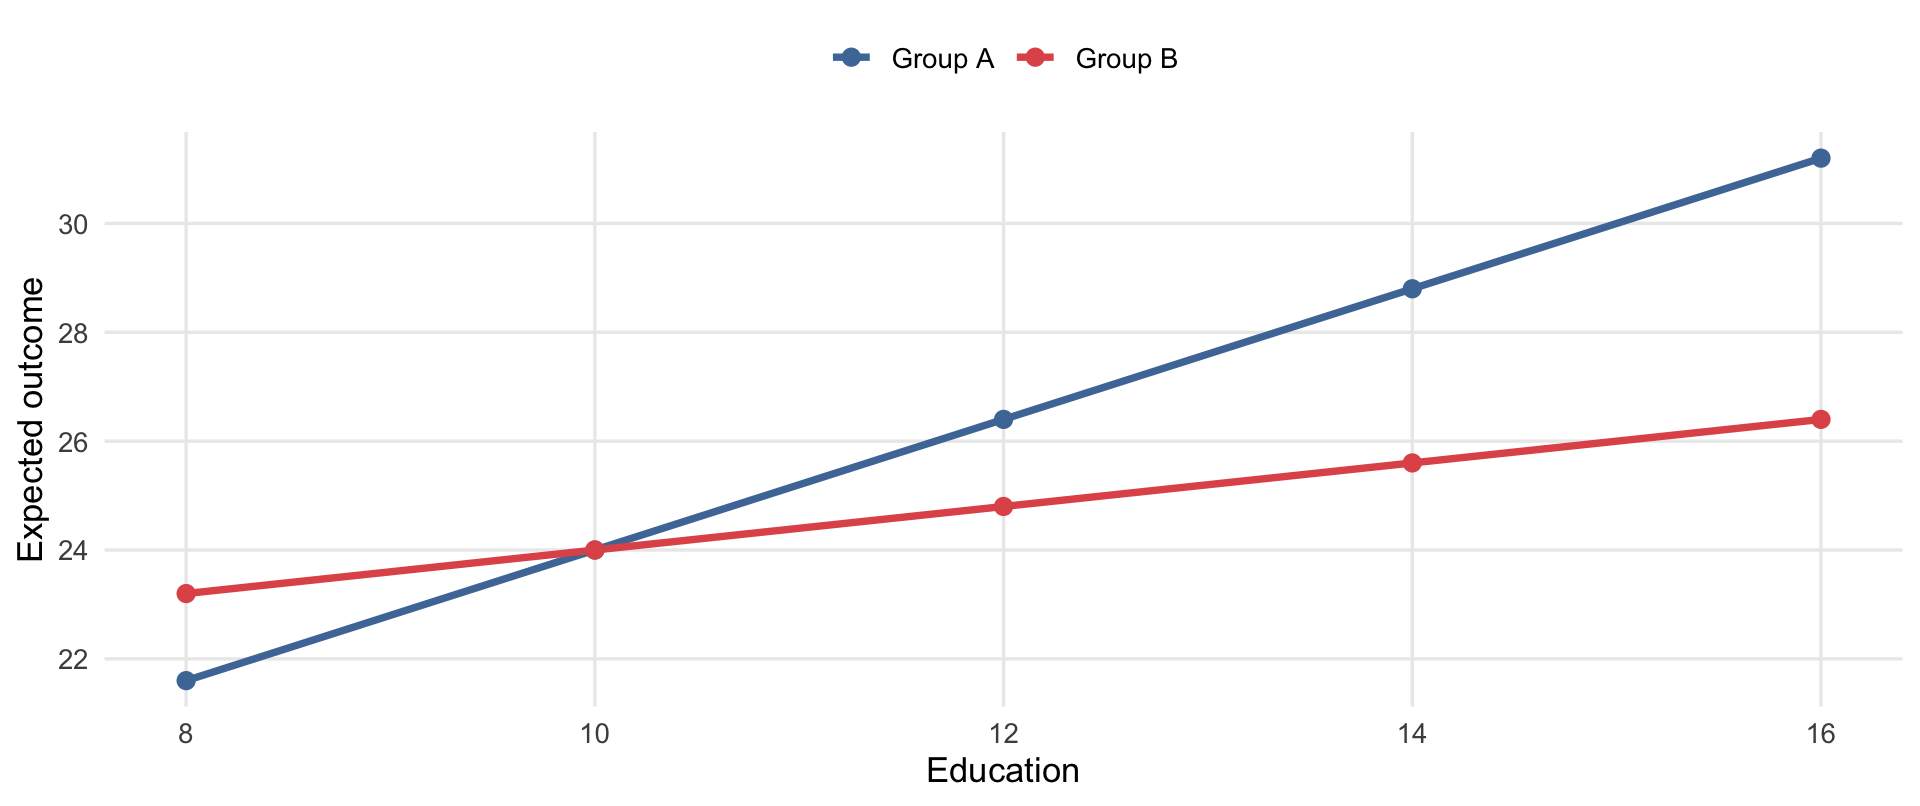
- Parallel lines suggest little or no moderation
- Non-parallel lines suggest the slope changes across groups or levels
- The lower-order terms and the interaction term all matter for interpretation
Sample interpretation
Group A’s education slope (1.2) is steeper than Group B’s (0.4) — group membership moderates the relationship between education and the outcome.
Moderation
| How to Identify | What Moderation does |
|---|---|
| Big question | For whom or under what conditions does X affect Y? |
| Third variable | Changes the slope |
| Typical model | Interaction term |
| Visual idea | Non-parallel lines |
| Example | Education predicts income differently for men and women |
Quick test
If a third variable changes the slope of X -> Y across groups or levels, that is moderation. Look for non-parallel lines in a margins plot.
Sampling and Figure Critique
Sampling
- A representative sample resembles the target population on the characteristics that matter
- In stratified random sampling you divide the population into subgroups (strata) first, then randomly sample from each — useful when you want to ensure representation of smaller groups (e.g., sample men and women separately)
- In cluster sampling you randomly select groups or locations first, then observe people within them (e.g., randomly select hospitals, then survey all patients inside)
- Nonresponse or selection bias happens when some kinds of people are systematically harder to reach than others
Figure critique
- Does the graph type match the variable?
- Are the axes labeled clearly?
- Is the title accurate?
- Is the scale misleading or truncated in a way that exaggerates differences?
- Are the units clear?
How to Study For Final Exam
- Revisit the slides and assignments on these topics:
- Weeks 7-9: sampling, distributions, CLT, confidence intervals, hypothesis tests
- Week 11: OLS regression and
R^2 - Week 12: logistic regression and odds ratios
- Week 13: interactions (moderation) and margins plots
- Redo one example each of a t-test, an OLS model, a logistic model, and an interaction model
- Practice explaining output in short written interpretations
- Review definitions you want to be able to write cleanly from memory:
- p-value
- confidence interval
- baseline/reference group
- moderation
- representative sample
Best use of your time
Do not just reread code. Practice explaining what results mean.
Questions?
- What topics still feel fuzzy?
- Which type of output do you want to practice interpreting one more time?