    Exact binomial test

data:  c(8, 3)
number of successes = 8, number of trials = 11, p-value = 0.1133
alternative hypothesis: true probability of success is greater than 0.5
95 percent confidence interval:
 0.4356258 1.0000000
sample estimates:
probability of success
0.7272727 Week 1
Sociology 106: Quantitative Sociological Methods
January 20, 2026
Agenda
Introductions
Welcome
Understanding the course
Install R and Positron – should be done by class next week
Learning Goals
Today’s learning goals:
- Have a sense of what the course is, what it is not, and what we’ll cover this semester
- Understand structure and requirements of the course
- Download and install
Rand Positron
Introductions
Kasey Zapatka, Postdoctoral Researcher
- PhD, Sociology, CUNY Graduate Center
- Urban inequality with a focus on housing, affordability, and neighborhood change
- Dissertation: gentrification -> influences housing affordability and affordability over the life course
- R/python, Machine Learning, MLM, causal inference, spatial econometrics
Introductions
Teaching
- Computational Social Science - course covering machine learning, text analysis, and causal inference
Current Research
- Impact of Emergency Rental Assistance on evictions during COVID-19 pandemic
- Voting turnout in New York City
- Text analysis of federal environmental review process
Now your turn
- Name
- Year
- Experience with
R(no right answer) - Mac or Windows user? (there’s a right answer)
- Why are you taking this course?
- What are you most looking forward to in this course?
Sociology 106 is…
…an intermediate undergraduate social science research methods course emphasizes the motivation, computation, and interpretation of statistical tests.
Course Content
- Statistical tests and their context (different types of variables)
- Interpretation of linear and logistic regression
- Open methods week
Skills Developed
Students will gain practical experience in R for conducting statistical analyses and managing data.
Sociology 106 is NOT…
…about math. Statistics is about adjudicating between rival explanations of phenomena about a population, using data from that population.
Focus on intuitive understanding and sociological application
Be more applied -> how and when to use the equation, not the equation
…about the “one true way to answer sociological questions” (where quals at?).
After Sociology 106, you will:
- Understand the logic of statistical inference
- Identify appropriate statistical tests for different types of data
- Visualize data and produce descriptive statistics and simple statistical tests using
R - Interpret and communicate statistical results and discuss their relevance in the context of a particular research question
One example:
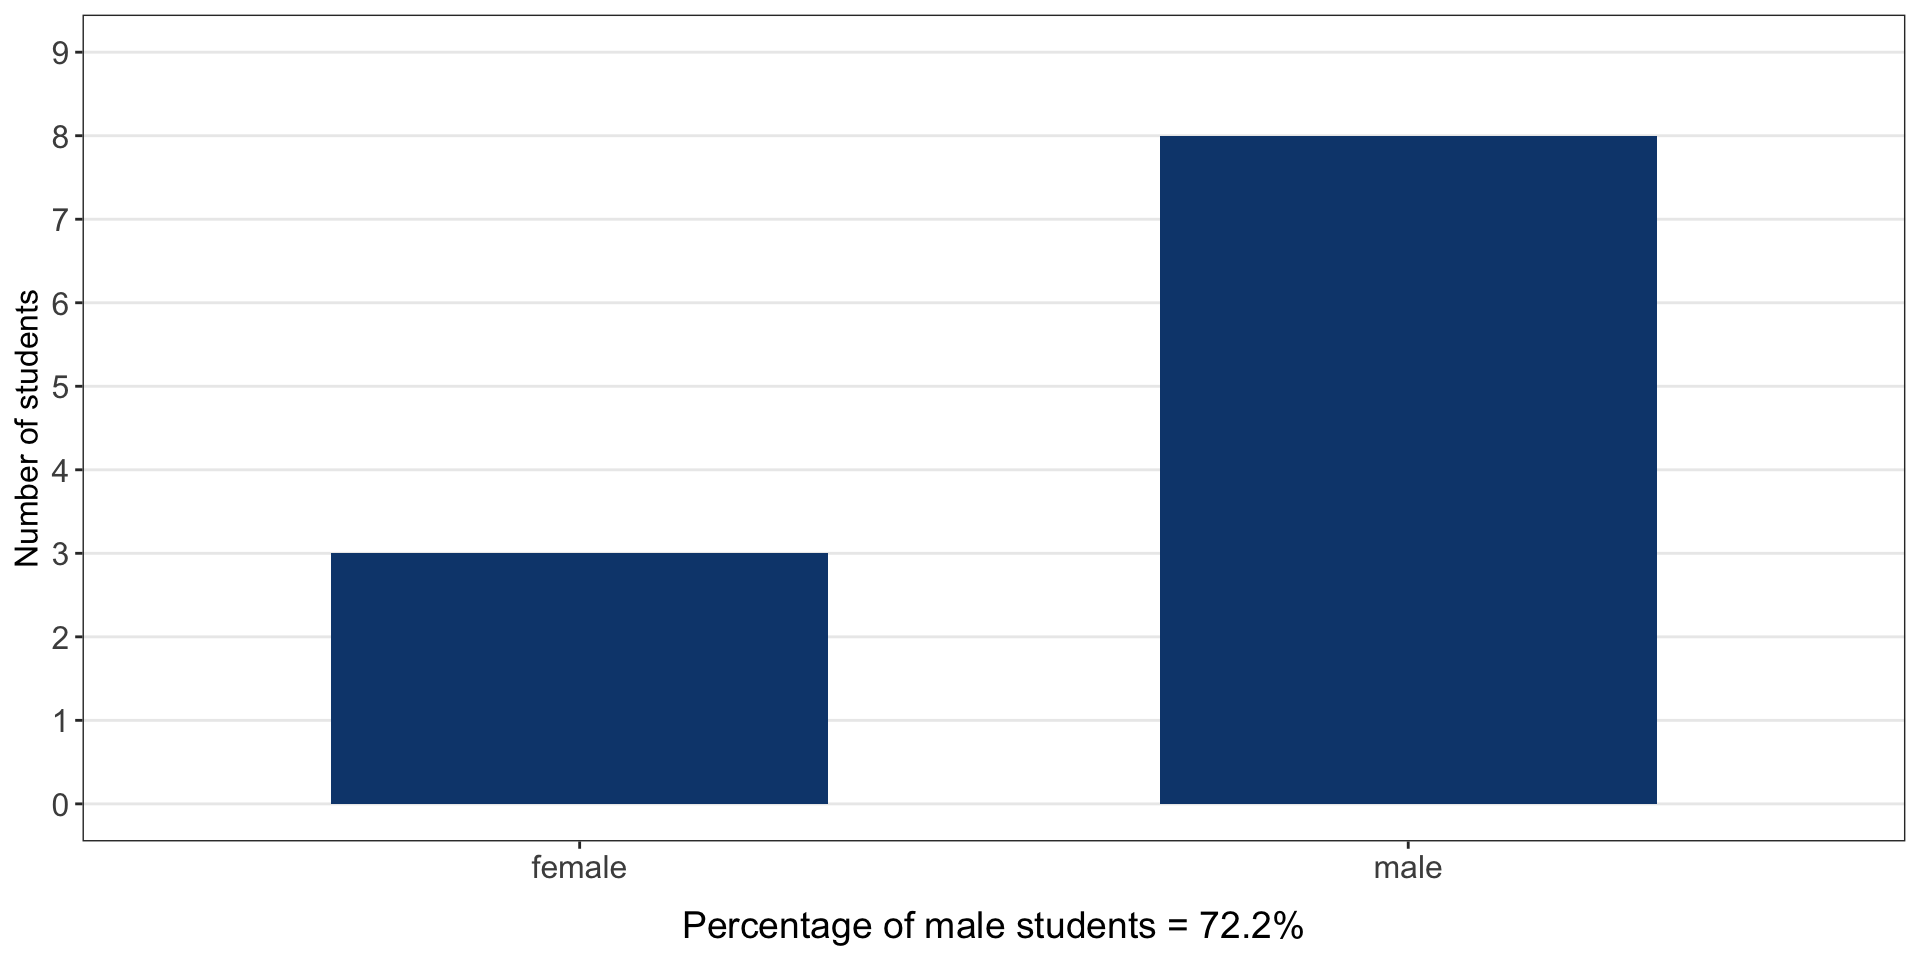
In past semesters, has Sociology 106 been more appealing to male or female students?
One possibility: gender doesn’t make a difference!
- Null hypothesis: P(student is male) = 50%
Another possibility: male students are more likely to major in Statistics
- Alternative hypothesis: P(student is male) > 50%
Could look at descriptive statistics
Some descriptive statistics…(from a previous semester!)
The probability model
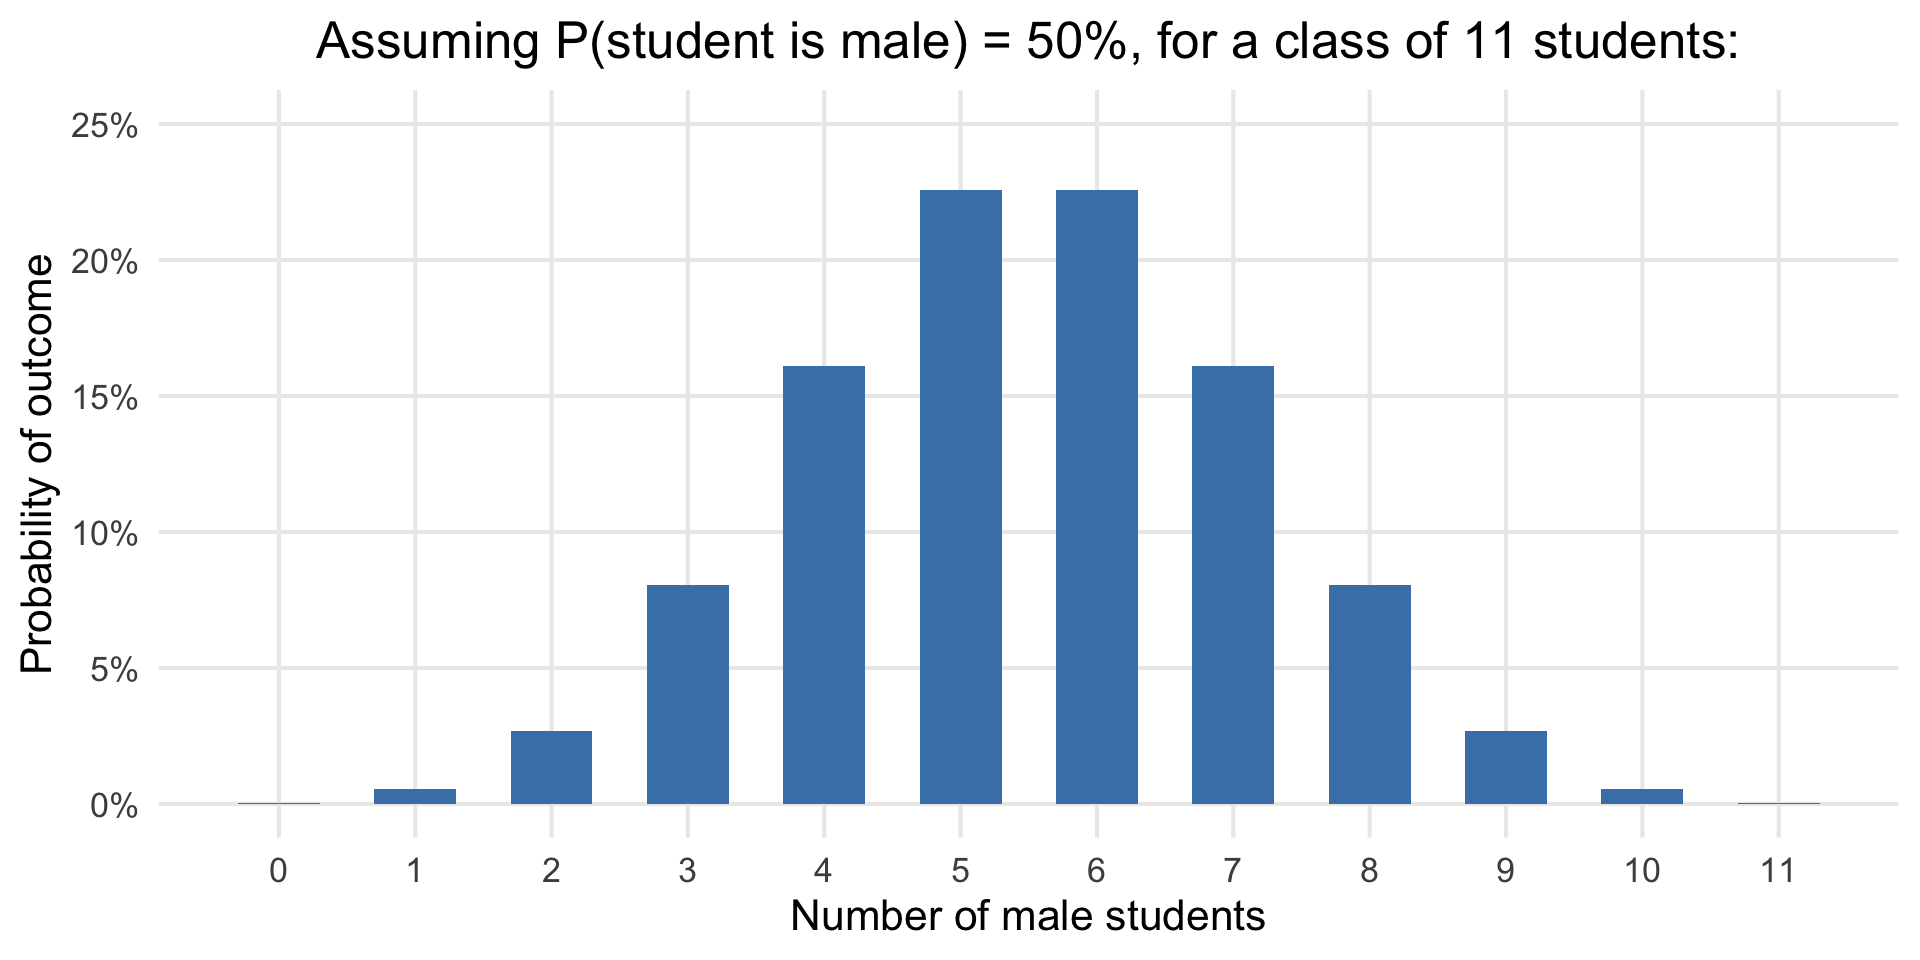
A statistical test
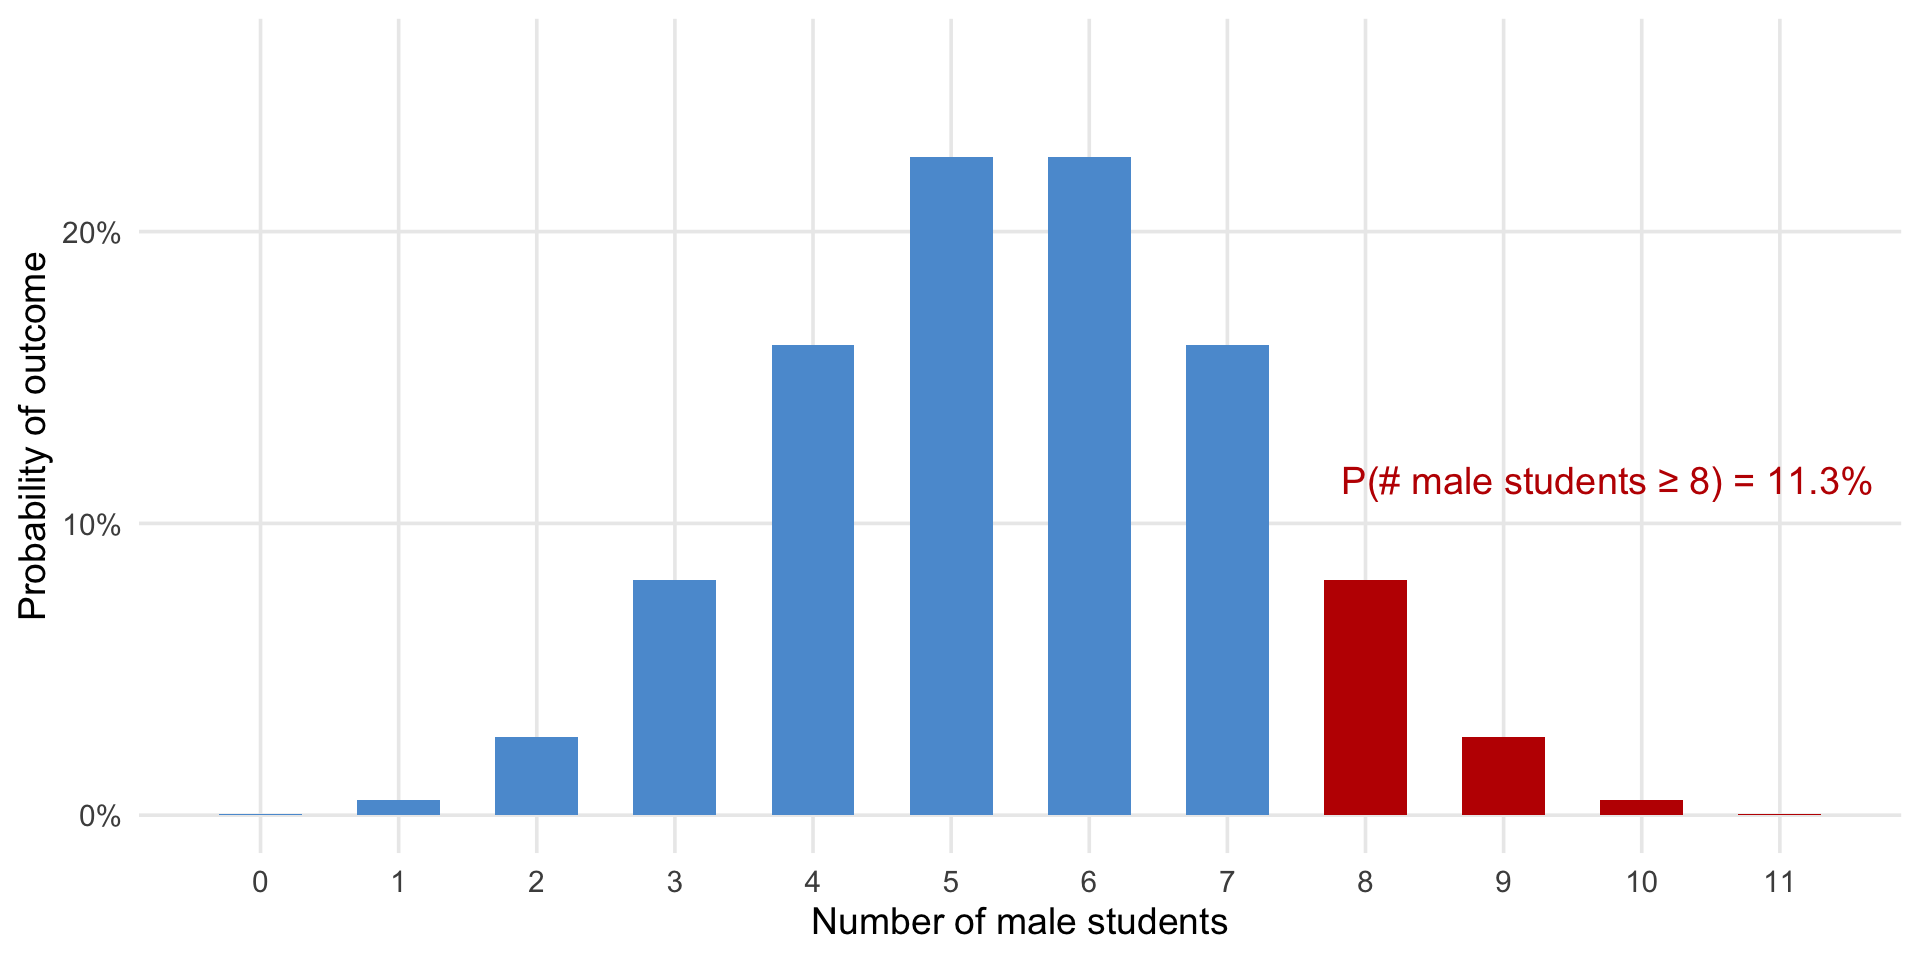
The same test, but in R
By the end of this course…
You will be able to test:
- Theories involving one categorical or continuous variable.
- Ex: gender is often measured as a categorical variable (male / female / other)
- Ex: income is often measured as a continuous variable (the number of dollars one earns is a real number)
- Theories involving how one (or more) binary or continuous variable affects another binary or continuous variable.
Questions?
Course Expectations
- Active learning - Lecture is for you so interrupt to ask questions if you have them
- Safe and productive learning space for researchers using these methods and supporting each other
- Expose you to a lot of coding and technical things but we can do it together
- We’re only learning the basics and that’s all I expect from you
- Coding in
Rcan be intimidating, but promise it’s worth learning how use - Positron is cutting edge IDE (most of grad students don’t use), but it’s the future of social science research
Course Navigation
bCourse is our bible
- home
- announcements
- assignments
- pages
- slides (each week)
- syllabus (pdf on bCourse)
Required Course Readings
David Lane’s Online Statistics (http://onlinestatbook.com/Online_Statistics_Education.pdf).
Hadley Wickham’s R for Data Science 2nd Edition (https://r4ds.hadley.nz), which is also free online.
We’ll read two journal articles to see how social scientists use regression analysis in practice.
Thompson, M.S., & Keith, V. M. (2001). The Blacker the Berry: Gender, Skin Tone, Self-Esteem, and Self-Efficacy. Gender & Society, 15(3), 336-357. (https://doi.org/10.1177/089124301015003002)
Freeman, L., & Braconi, F. (2004). Gentrification and Displacement New York City in the 1990s. Journal of the American Planning Association, 70(1), 39–52. (https://doi.org/10.1080/01944360408976337)
Open week
Open week at the end to fill it with something useful to you all.
Some options:
- brief intro to machine learning
- survey of more advanced methods (e.g., fixed effects, MLM, spatial regression, Poisson/Negative Binomial, etc.)
- open to class suggestions
Will take a class vote in week 3
Required Course Materials
Access to a laptop where you can download:
R(http://cran.rstudio.com), an open-source programming languagePositron (https://positron.posit.co/download.html), a free program that makes working in
Rmuch easier and is at the cutting edge of data science right now.
We’ll start installation of R and Positron at the end of class–this must be done by class next week
Course Elements
- Attendance and participation (10%)
- Weekly homework assignments (30%)
- Research paper (40%)
- Final exam (20%)
Class Format
First half of class (give or take) will be a lecture where I go over new statistical concepts and show you how to implement these statistical concepts in R
Second half of class, either you will have time:
- to start hw assignments that practice implementing these concepts in
R - we’ll have extra time for questions/followups
- we’ll discuss the research papers a bit more in-depth
Typical Weekly Assignment
- From 3-10 problems with brief analysis and write-up in
Rand quarto - Show your work – explain conclusions and interpret results as necessary
- Work with your own dataset (with some exceptions) and apply methods
- Use same dataset each week -> research paper
- For the first assignment, I will provide a dataset on bCourses
- Think carefully about the method, types of questions it can answer, types of variables that can be used before choosing variables from your dataset
- Submit answers using Quarto (.qmd) template provided on bCourses to submit to bCourse
- Grading:
- 0 = not turned in
- 1 = below expectations
- 2 = meets expectations
Research Paper
Develop and present a research question of your choice, address it using statistical techniques from the course that you apply to data in R, and write a paper summarizing your findings
You can (and should) use your weekly assignments to work on your research question
Several milestones throughout the semester (40%)
- Paper proposal (5%)
- Annotated bibliography (5%)
- Revised paper proposal with outline (5%)
- In-class presentation (5%) – 7-10 mins
- Final paper (20%)
Keys to Success
Material is cumulative, so it is critical to keep up
- Please ask questions during lecture!
- If you find yourself falling behind, seek help immediately from me during office hours
Learning statistics requires thinking through how to solve problems
- This is what the weekly assignments are for; you should not expect to fully understand the material until after you have completed the assignment
- Feel free to work on assignments in groups, though what you turn in must be your own work.
Keys to Success
Learning statistics is like learning a language
- The material in this course can be challenging / counterintuitive if you haven’t seen it before
- It is important not to be intimidated by new terms or the use of letters to represent quantities or variables
- Review your algebra skills if necessary
Lecture slides will be made available, but are not a substitute for careful note taking
Office Hours
I can help in office hours with questions about concepts from lecture or about coding in R
- Tuesdays, 11:30 AM-1:00 PM, 444 Social Science Building
- Tuesdays, 4:00 PM-4:30 PM, 444 Social Science Building
- If you can’t make either, e-mail me and we’ll find a time
Outside of office hours, your best resources are your fellow classmates!
- If something is really unclear to you and others, e-mail me and we can go over it in next week’s lecture
Online and Generative AI Policy
- PLEASE USE THEM!–AI tools (e.g., ChatGPT), Google, and online resources (e.g., StackOverflow or StackExchange)
- DO use these tools to better understand concepts, debug code, suggest libraries or packages, or offer sample code to guide learning.
- DO NOT copy or paraphrase AI-generated content in any assignment, as this counts as plagiarism
- The goal is to use them to support your learning and problem-solving, not to replace it.
If you are going to spend the time taking this course, you should learn as much as you can.
Questions?
Getting started with R and Positron
Download and install R1
https://cran.rstudio.com
Download and install Positron2
https://positron.posit.co/download.html